Physical Address
304 North Cardinal St.
Dorchester Center, MA 02124
Physical Address
304 North Cardinal St.
Dorchester Center, MA 02124

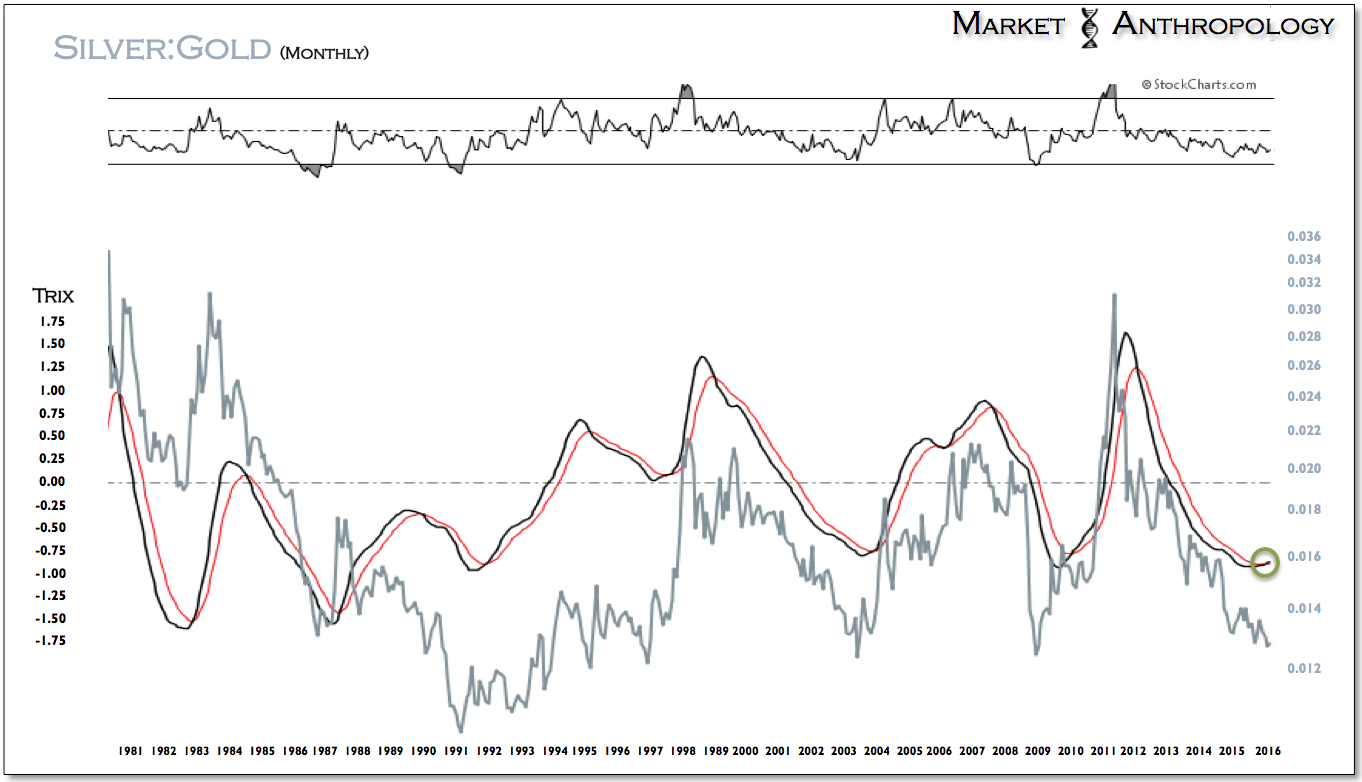
When it comes to gold, the recent technical hurdles overcome by the yen, bodes bullish towards gold’s future prospects. And although our outlook for gold and precious metals is primarily derived from an expectation of broad dollar weakness (i.e. firming inflation & declining real yields); as mentioned in previous notes, we’ve closely followed the yen as a leading proxy for gold.
Both gold and the yen have trended closely together since the equity markets peaked in October 2007 and the financial crisis unfolded over the next two years. While gold set its closing high eight weeks before the yen in 2011, it subsequently followed its downside breaks with varying lags of several weeks. From a performance perspective, both assets declined around 40 percent (yen 40% & gold 45%) from their respective cycle highs in 2011.
On a weekly timeframe, the yen is working on its first close above the broad range established since the end of 2014.


Following up on our thoughts in last weeks note (see Here), we wanted to point out the breakdown similarities that we have been following in the dollar – compared to the EUR/USD breakdown during the late summer market decline in 2011. Although the top has been much broader than we expected last year, not surprisingly, it is the inverse relationship today that is coming under pressure, as the euro has been a major funding currency in the markets over the past few years.


This is also why we expect the move in precious metals to have greater staying power in 2016, as the currency backdrop in the markets shifts from dollar strength to weakness.

The precious metals miners, who had replicated their downside moves over the past several years, have begun to break out of the repeating pattern.
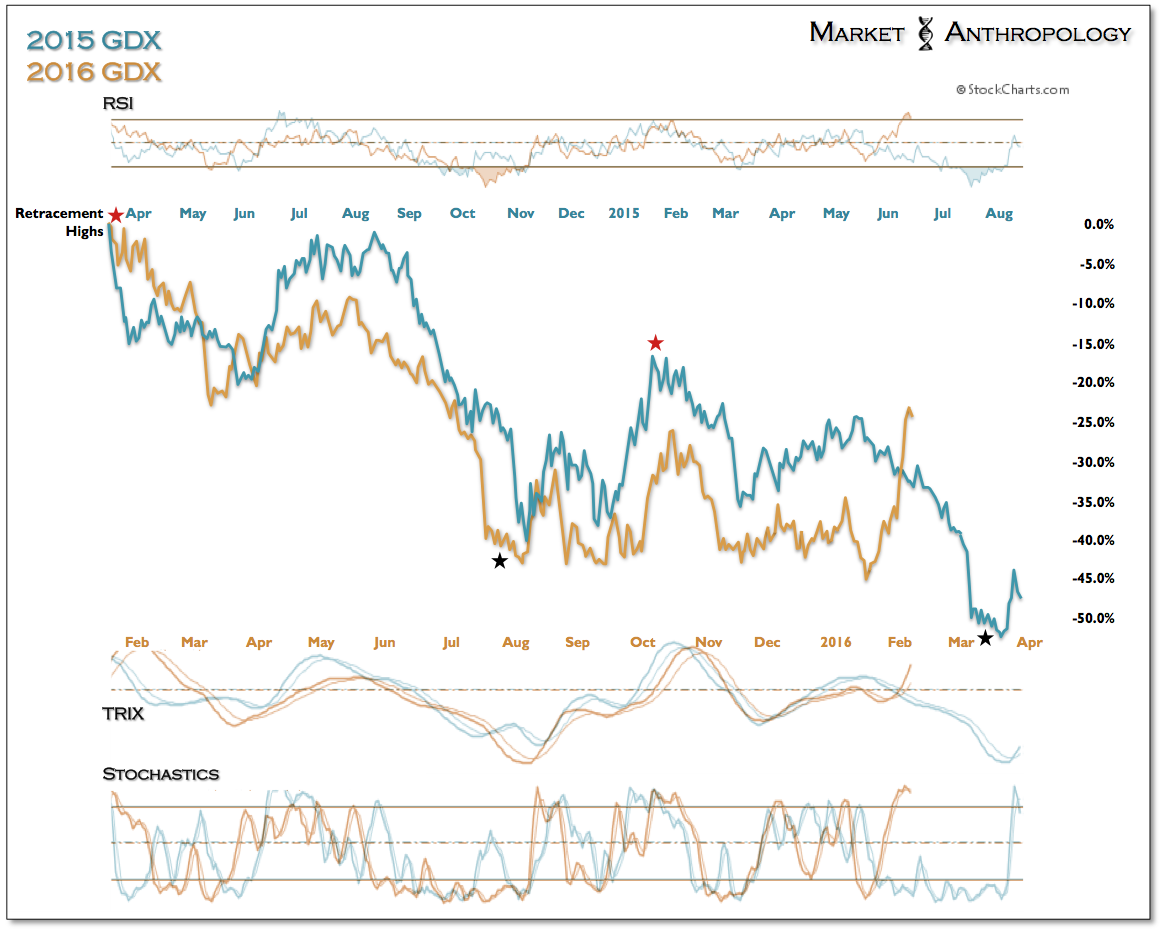

And just as the financial sector has come under significant pressure in recent weeks, the miners have taken the outperformance baton from the banks, that in Q3 2011 finally caught a bid as the inflation driven market theses were cresting and turning down.

Generally speaking, we still find precious metals very attractively positioned going forward, assuming 1) the dollar cyclically turns down; 2) inflation keeps its foothold, 3) nominal yields remain historically low, and hence – real yields decline.
All things considered, with financial markets likely remaining under pressure this year and central banks broadly limited, we see no reason to believe that real yields won’t ultimately test their respective 2011 lows, which augurs that another significant move higher still remains on the horizon for precious metals.