Sans the ever wilder world of bitcoin – more of the same since last month’s note, as spreads between short and long-term Treasuries continue to narrow, with 2’s and 10’s earlier last week at their tightest levels since the previous equity market peak in October 2007.
That said – and contrary to the market environment in Q4 2007 where spreads had been widening for several months as both short and long-term Treasury yields fell, but shorter-term yields fell faster – the curve today has continued to flatten as shorter-term yields have climbed and “outperformed” the long-end, greatly buoyed by staunch confidence of another rate hike by the Fed this week and tepid expectations towards rising inflationary pressures next year.
The cyclical disinflationary gravy train that began in Q4 2011 as the US dollar and real yields carved out their respective cyclical lows, has handsomely rewarded both equity and credit investors alike, at the expense of more inflationary driven assets – like commodities. And while there are many that believe that a secular move higher in equities began in 2013 as indexes broke out above their previous 2007 cycle highs, that observation appears mostly biased by simple technical disposition and ignorant of a wider historical perspective and understanding of the long-term yield/growth cycle – we believe essential to even considering more lasting secular persuasions.
The long and short of things – which appears entirely personified in the speculative microcosm of bitcoin mania these days: trade it while it lasts, but don’t be fooled by price alone. Valuations anchor all returns in the long run, and that rope between expectations and reality is exceptionally long and extraordinarily taut today.
Besides the unconventional and extraordinary monetary policy approaches applied in the markets since the global financial crisis, expectations continue to be muddled by the massive scale of the long-term yield and growth supercycle that we believe ultimately exerts the greatest influence on the respective equity and commodity sub-cycles over the long-term. Simply put, investors need to balance expectations by also viewing the overarching cycle through a market historian’s wide-angle lens, rather than just a weatherman’s radar display of current market conditions.
Granted, much easier said than done, as prudence typically takes a back seat to the ever pressing consequence of the fear of missing out. Heck, what’s a measly 20 percent return, when your kid’s teacher bought some crypto last week and doubled his “investment” – just because his nephew bought a bitcoin financed Bimmer on a cheap ticket punched in June? As if Millennials weren’t disliked enough already, returns in their preferred investment vehicle over the past year rival equities over the entirety of the more than 35+ year secular bull market. From a speculative point of view, there’s never been anything like it – and it’s happening right now. Chew on that.
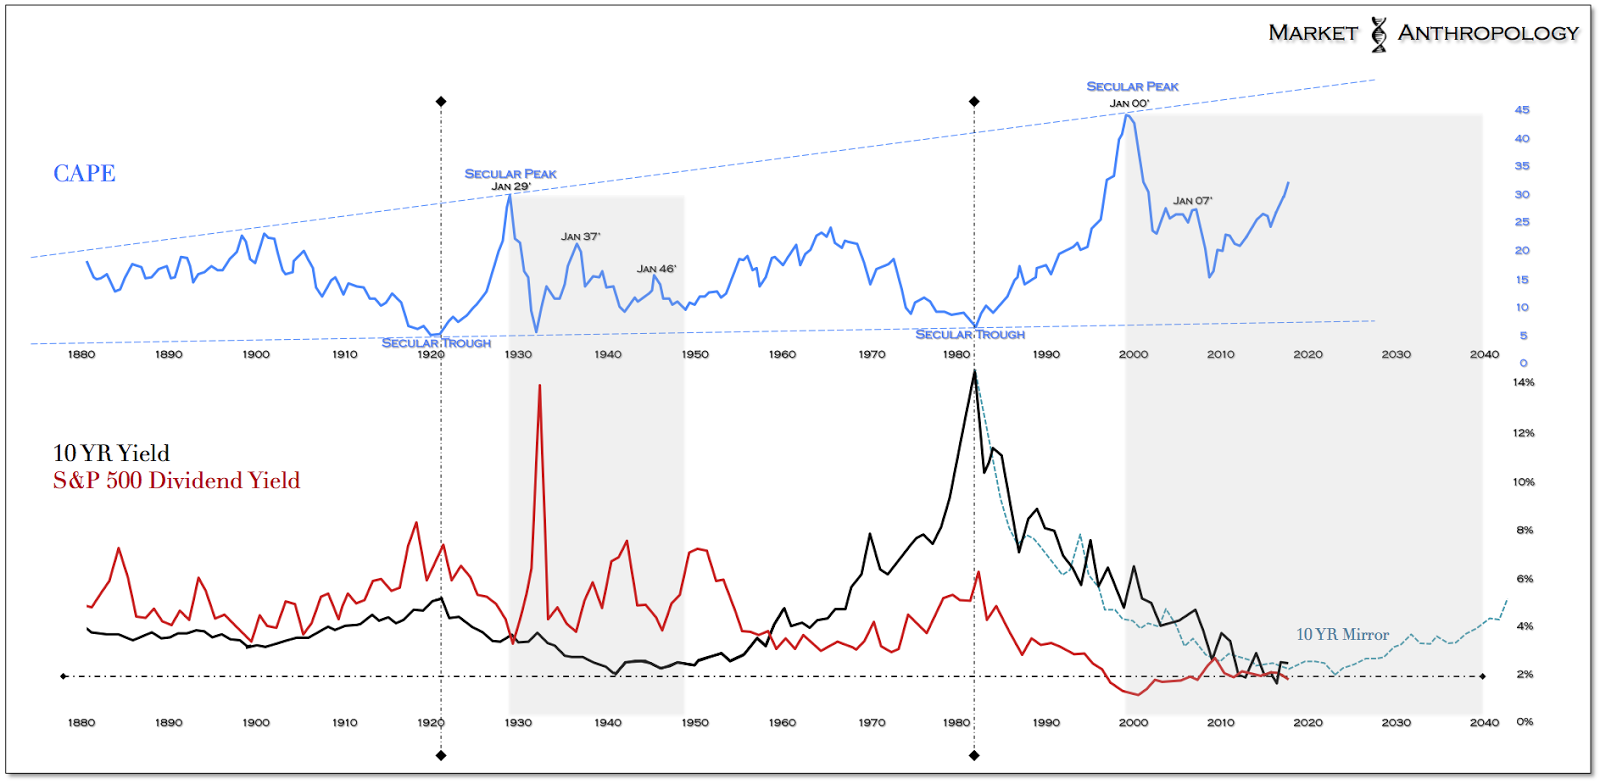
Getting back to a more stodgy and puritan landscape… When you look back at the span of the broader long-term yield cycle, you’ll find it was a period in history that encompasses 70+ years of remarkable growth, the last 35+ of which were traveled with increasingly benevolent credit conditions, in which the US has enjoyed elevated equity market valuations on the back of a proportionately massive secular downdraft in yields. Historically speaking, the significant investments and advancements in the world economy that took place directly after World War II, helped drive growth, inflation and eventually yields to such Icarus heights – that countries, central banks, corporations and individuals have enjoyed the voluminous book-end benefits of a declining rate environment for well over 35 years. This in a nutshell built the long road to the top of the equity market cycle on the back of ever cheapening credit and ever more accommodative monetary policy.
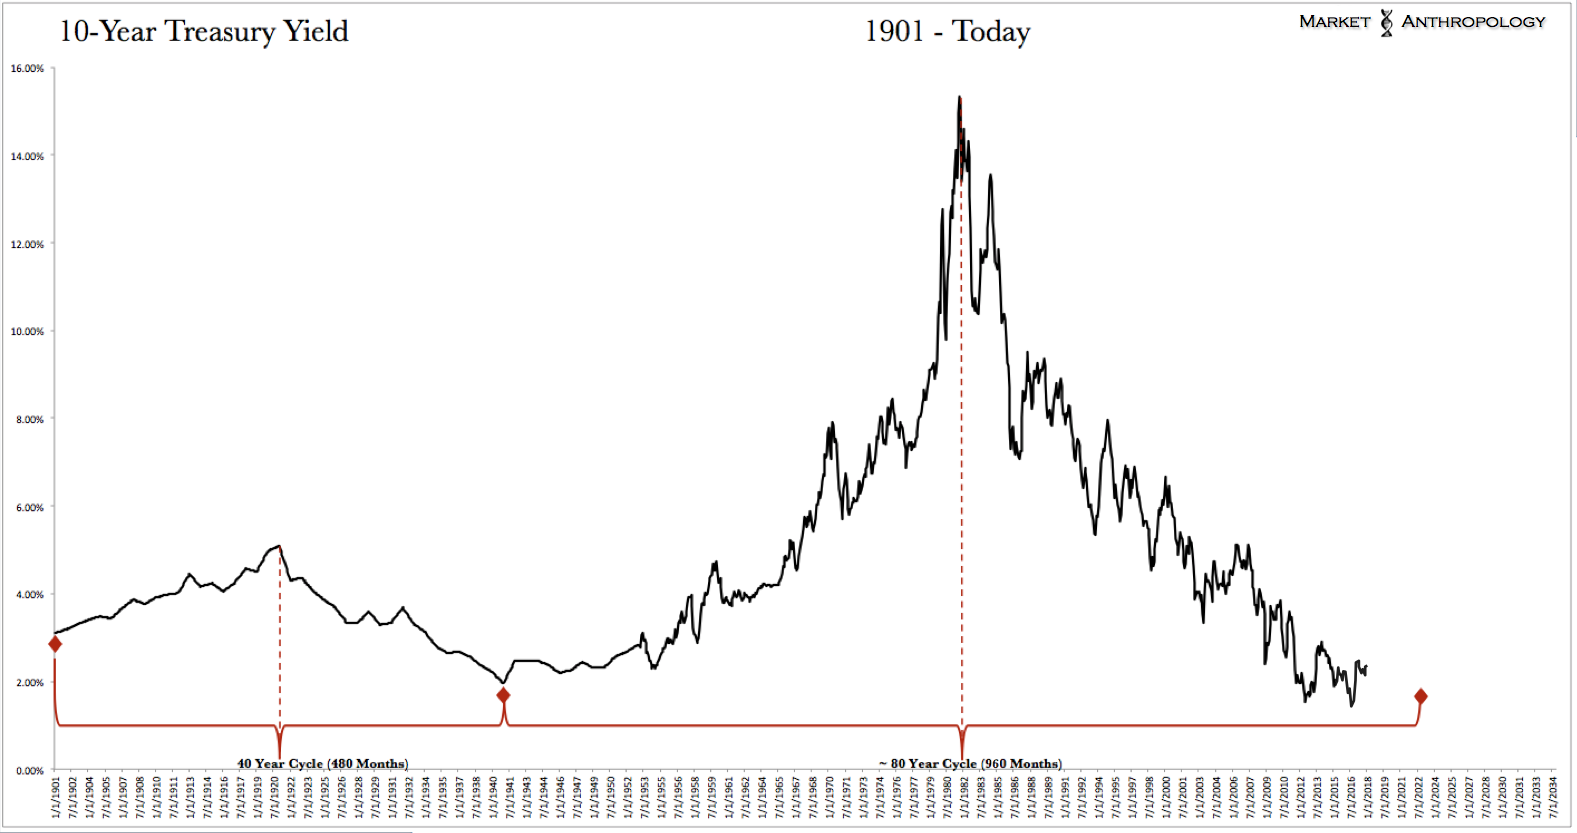
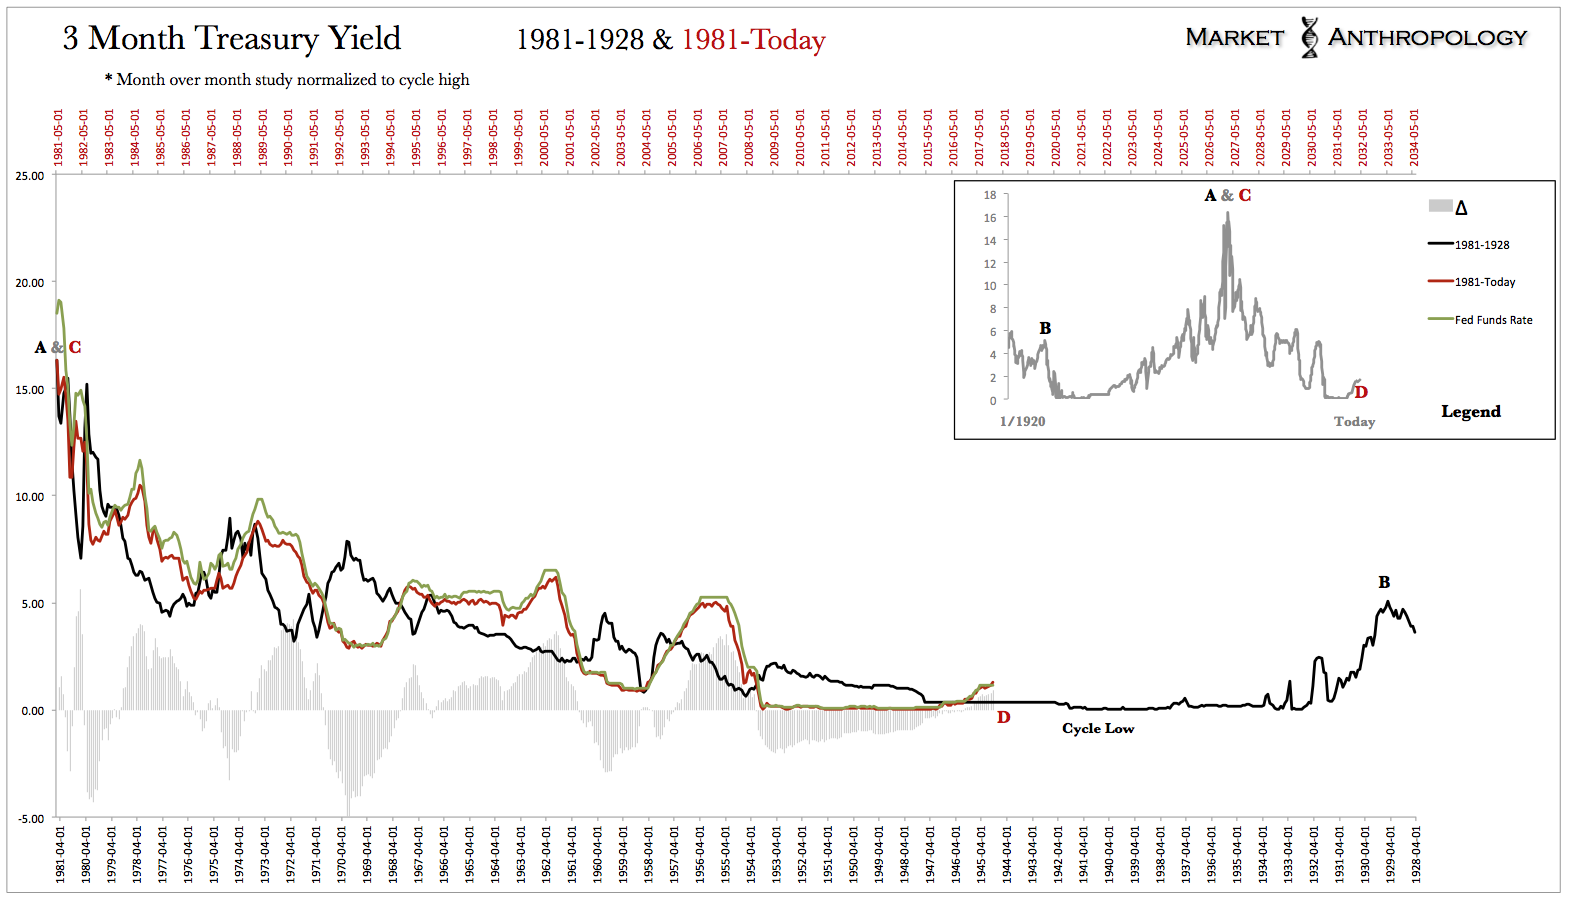
Interestingly, the relative symmetry represented in the current yield cycle is not unusual and quite characteristic when you look back at several hundred years of market history.
* Click to enlarge images
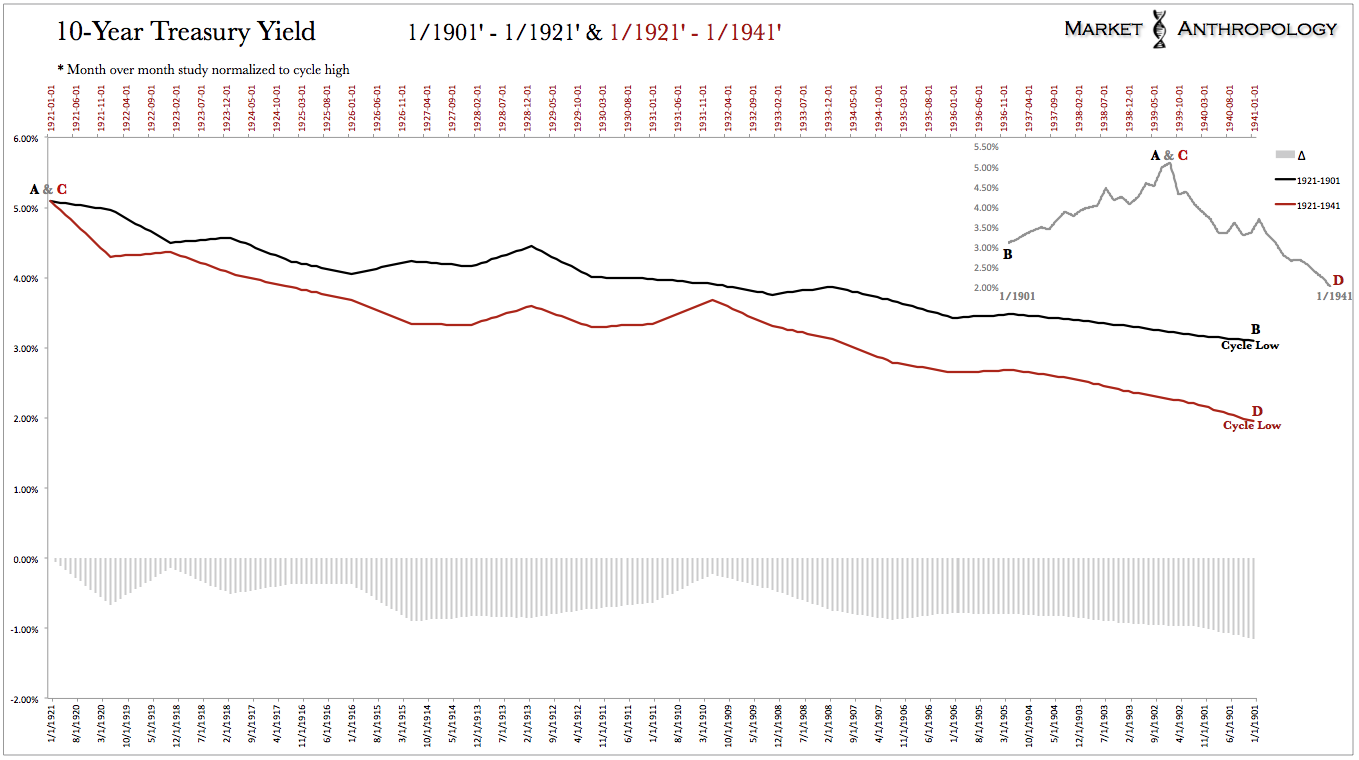
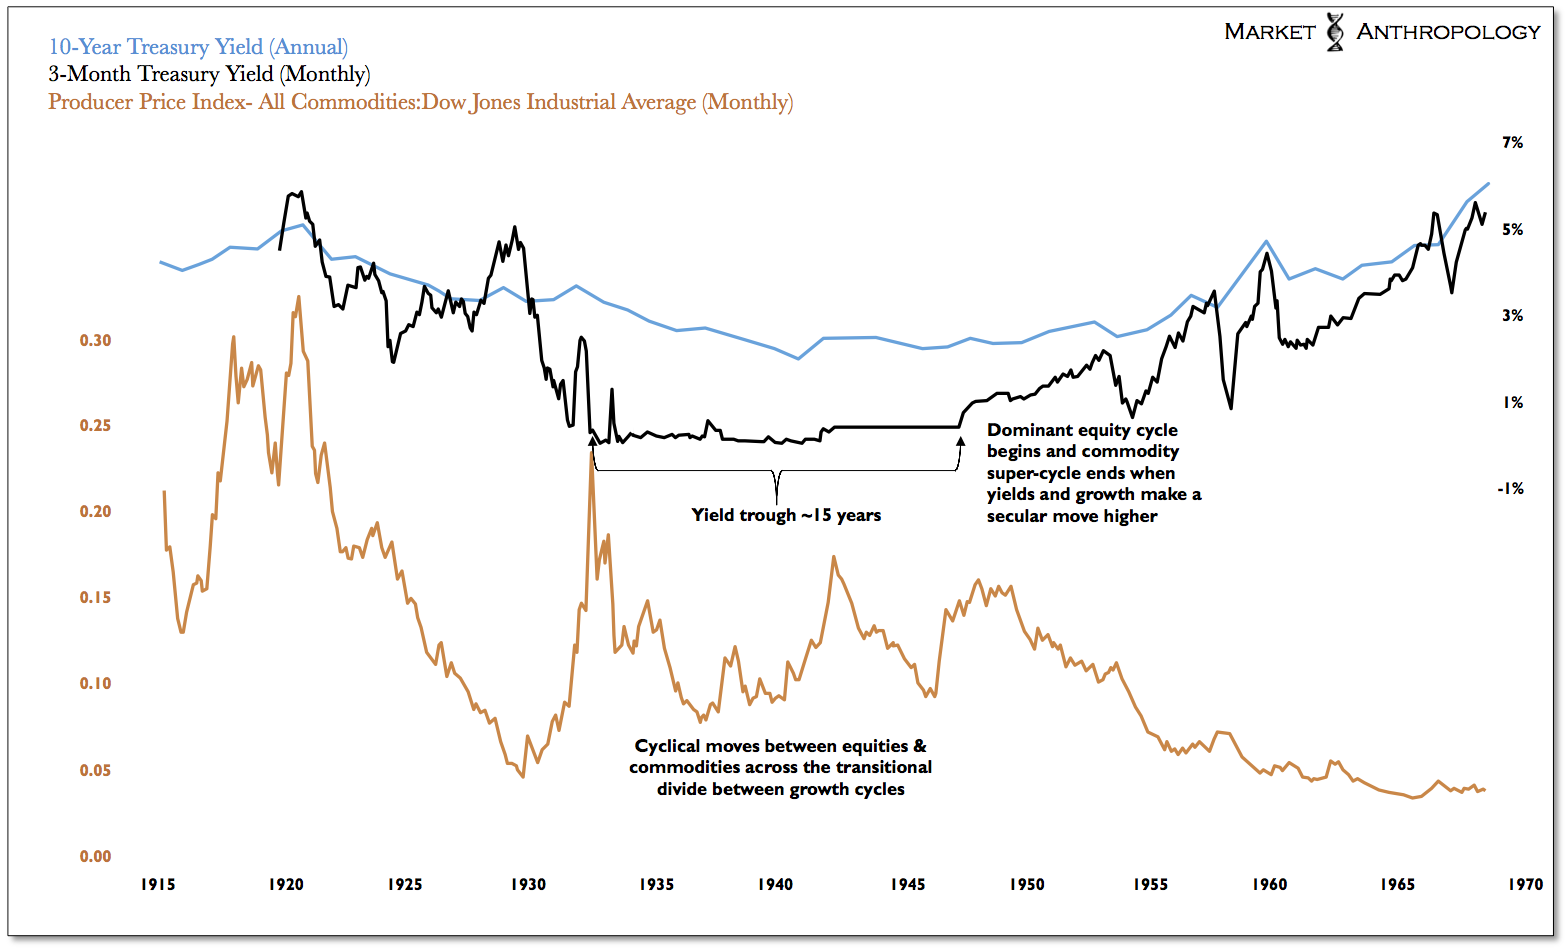
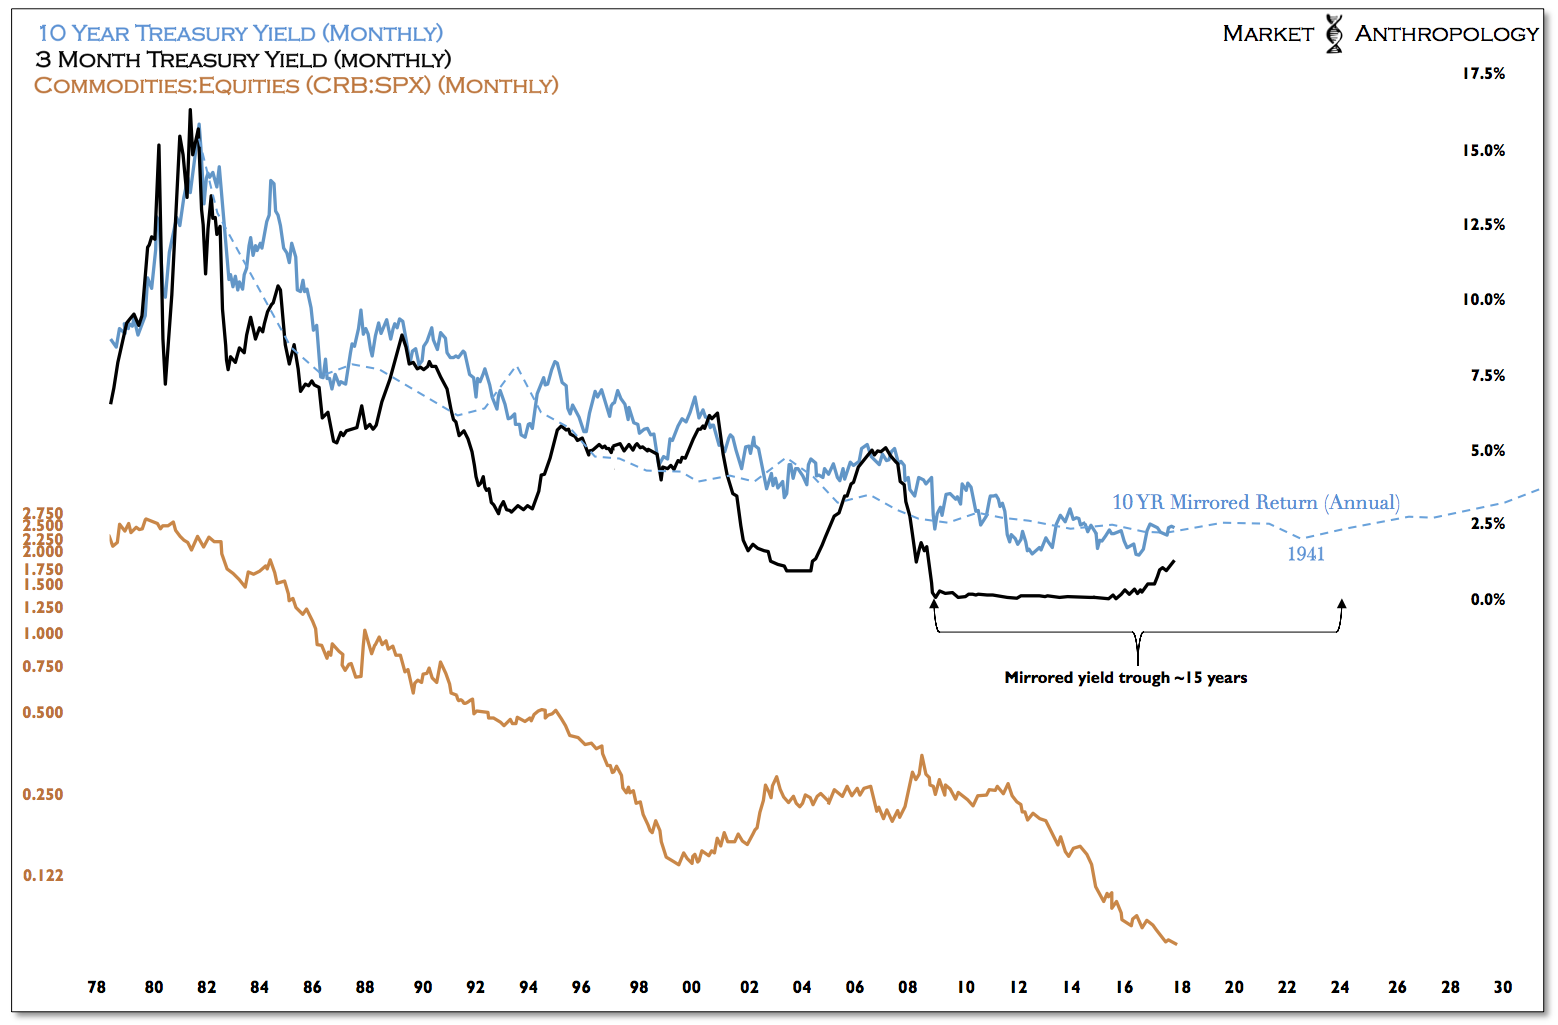
The previous cycle (from trough to trough) spanned 40 years to the month; a period in which yields rose for 20 years – followed by a 20 year decline. Unlike the current downtrend in yields that has trended to the trough with increasingly more symmetry with the mirrored rise in yields from 1941 to 1981, the previous cycle exhibited an asymmetric return below the 1901 lows, as economies pushed up against the limits and unbalances exposed and magnified during the great depression – and markets stumbled their way across the transitional divide to the next major growth cycle.

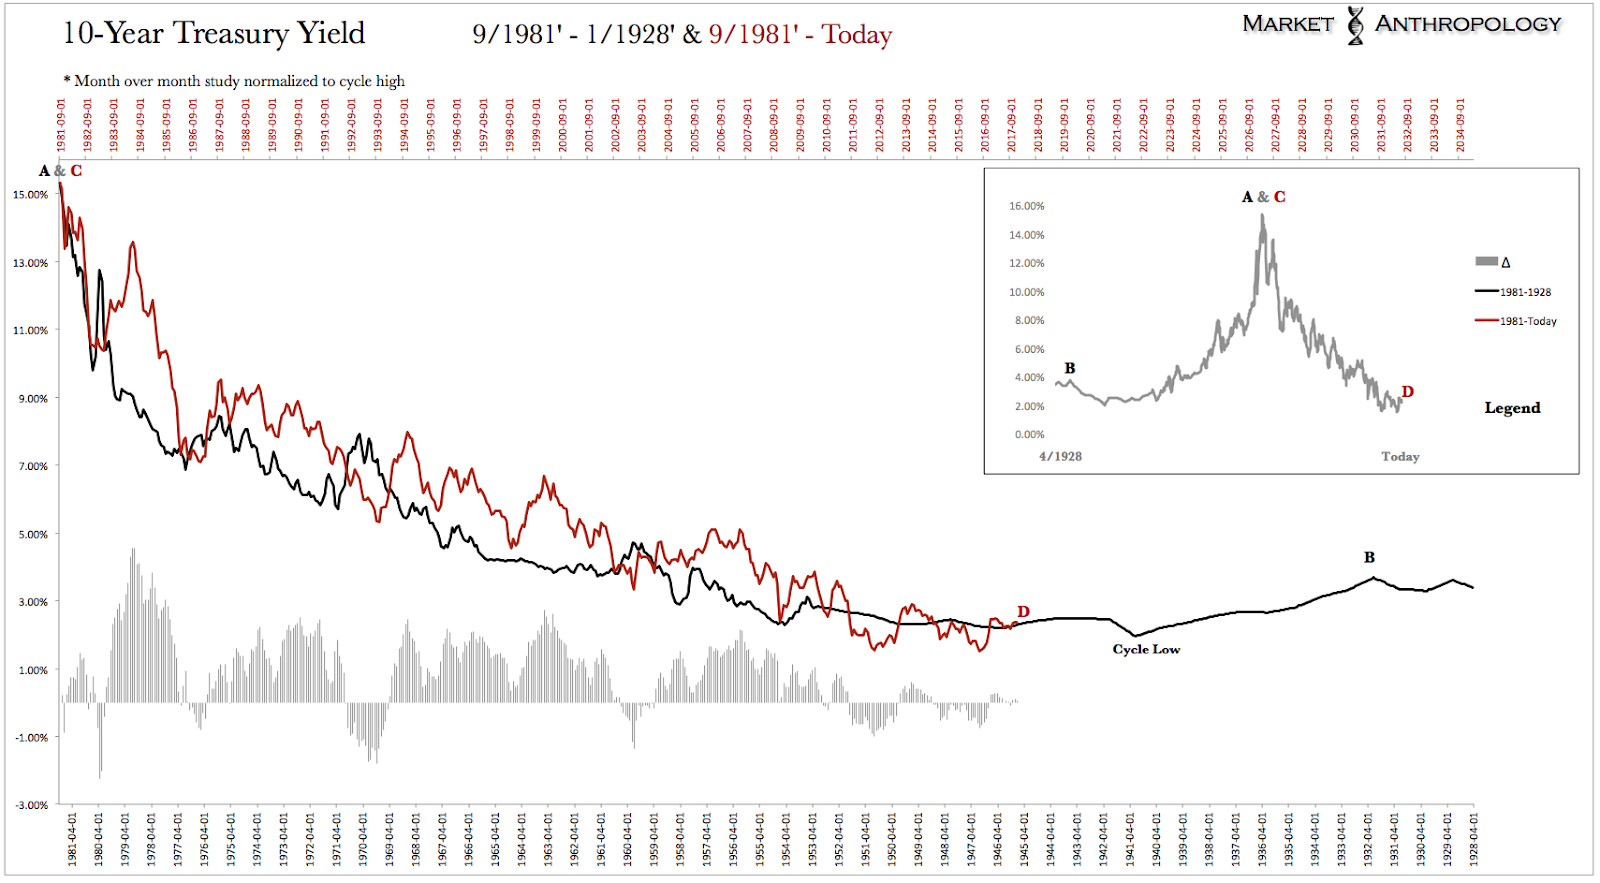
Comparatively, the secular peak in yields in 1981 was over three times as steep as the previous secular peak in 1921 – and the broader span from trough to trough of the current move (1941 – today) will likely be over twice the previous cycles length (1901-1941′). Consequently, the massive range and structure of the current long-term yield/growth cycle represents the enormous scale that market participants should balance their more long-term and secular expectations within.

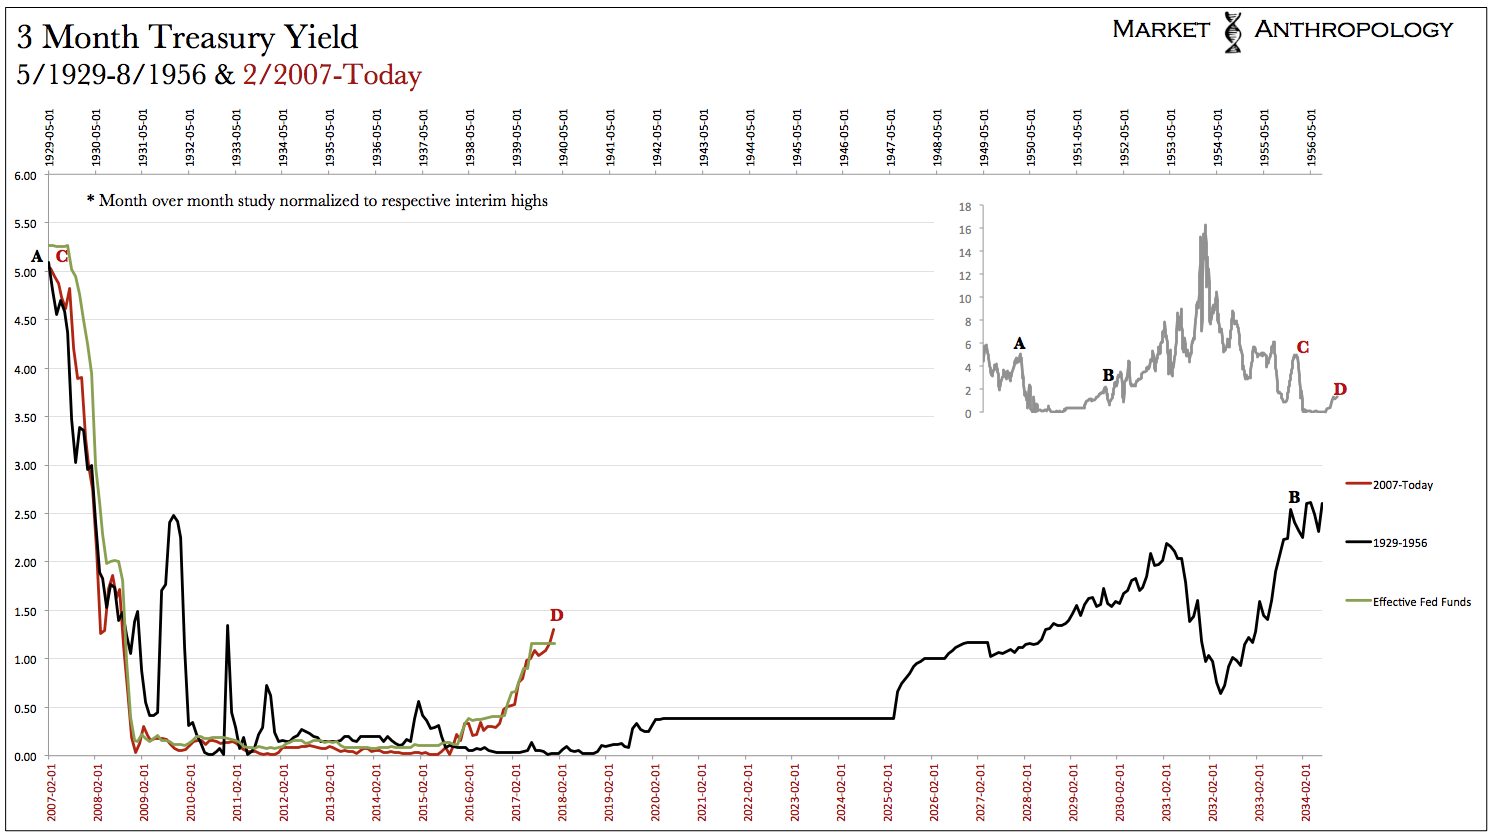
Believing that the broader system will normalize and reboot to the next long-term cycle without a prolonged period of transition (i.e. secular stagnation – we like transitional divide) – even proportional and commensurate with the previous trough – is unfounded even along the irrational continuum markets often walk out on. In this respect – and as was the case across the previous transitional divide in the 1930’s and 1940’s, look for alternating periods of outperformance between equities and commodities extending well into the next decade, before a more secular move higher begins beneath growth, yields and equities.


The main takeaway for us, is that although equity markets have extended far offshore to relative valuation extremes today, the anchor of the broader long-term yield and growth supercycle will eventually pull returns lower as economies move further away from the easy credit conditions and accommodative monetary policy approaches that have greatly defined the current disinflationary sub-cycle since 2011. Considering the major influences of US dollar strength and extraordinary monetary policy accommodations that have gradually receded over the past few years, the disinflationary tradewinds that have greatly supported equities – but were headwinds for commodities, will eventually dissipate entirely in the current doldrums (i.e. goldilocks conditions) the markets remain in. Filling the void will be either rising inflation – deflation, or relatively brief cycles of both. We suspect we’ll see the former stretch its legs further, before the latter threatens yet another return. That said, we’re reminded this isn’t the summit of the yield/growth cycle of the 1970’s were inflation had ample fuel to burn – but likely the middle of the trough, where outbreaks of inflation burn fast and bright before exhausting whatever oxygen remains in the economy.


______________________________________
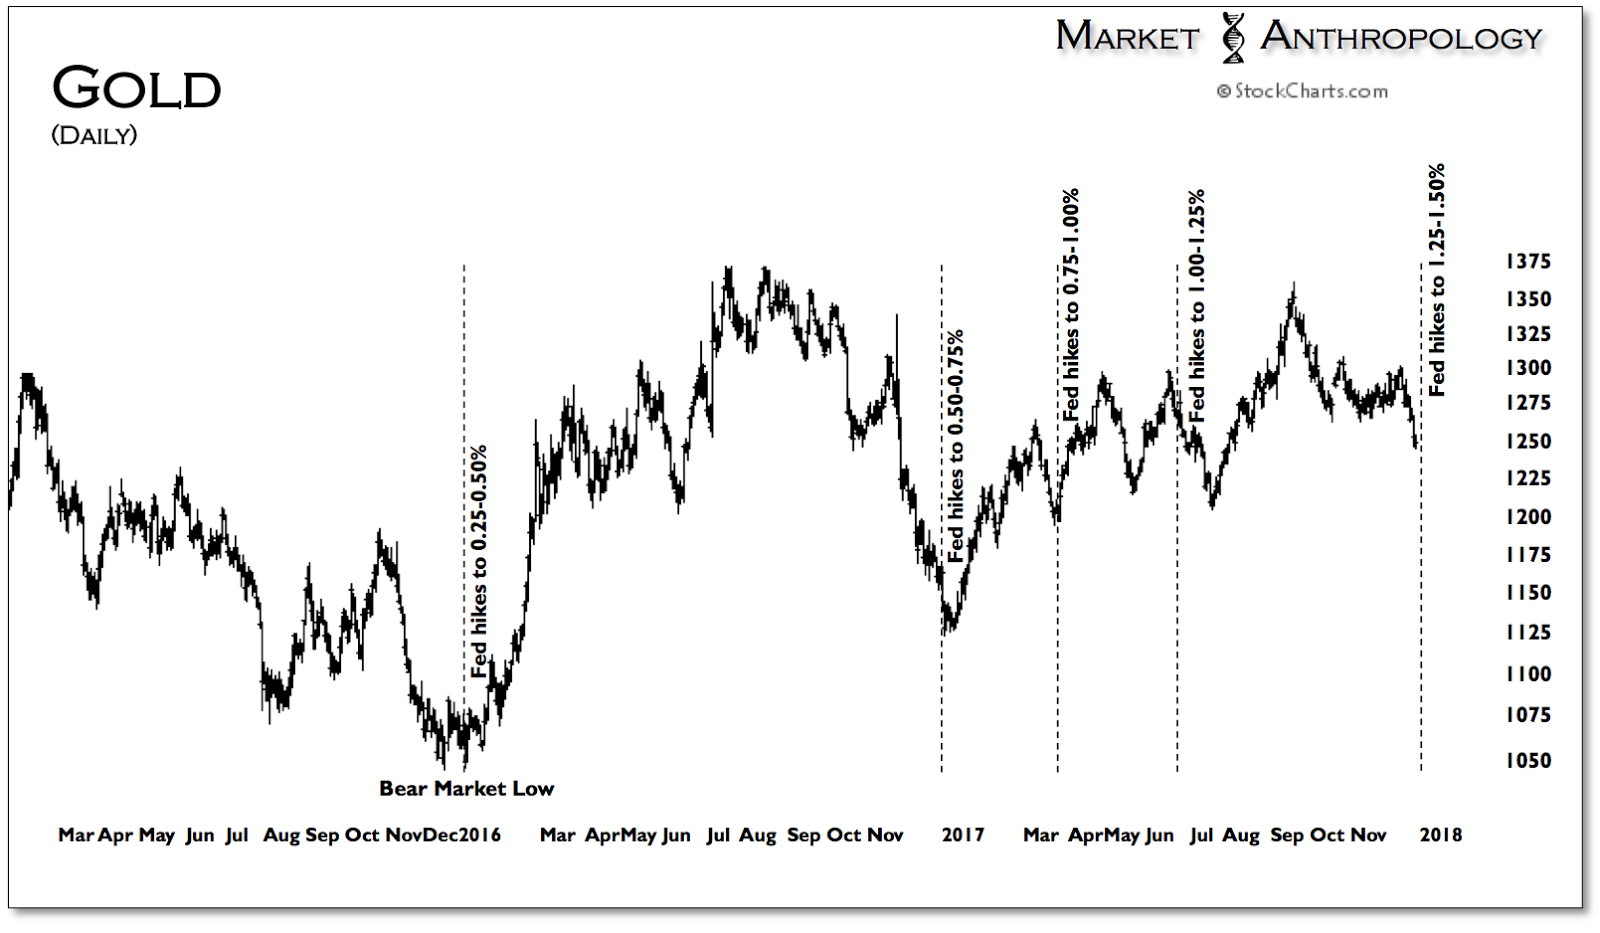
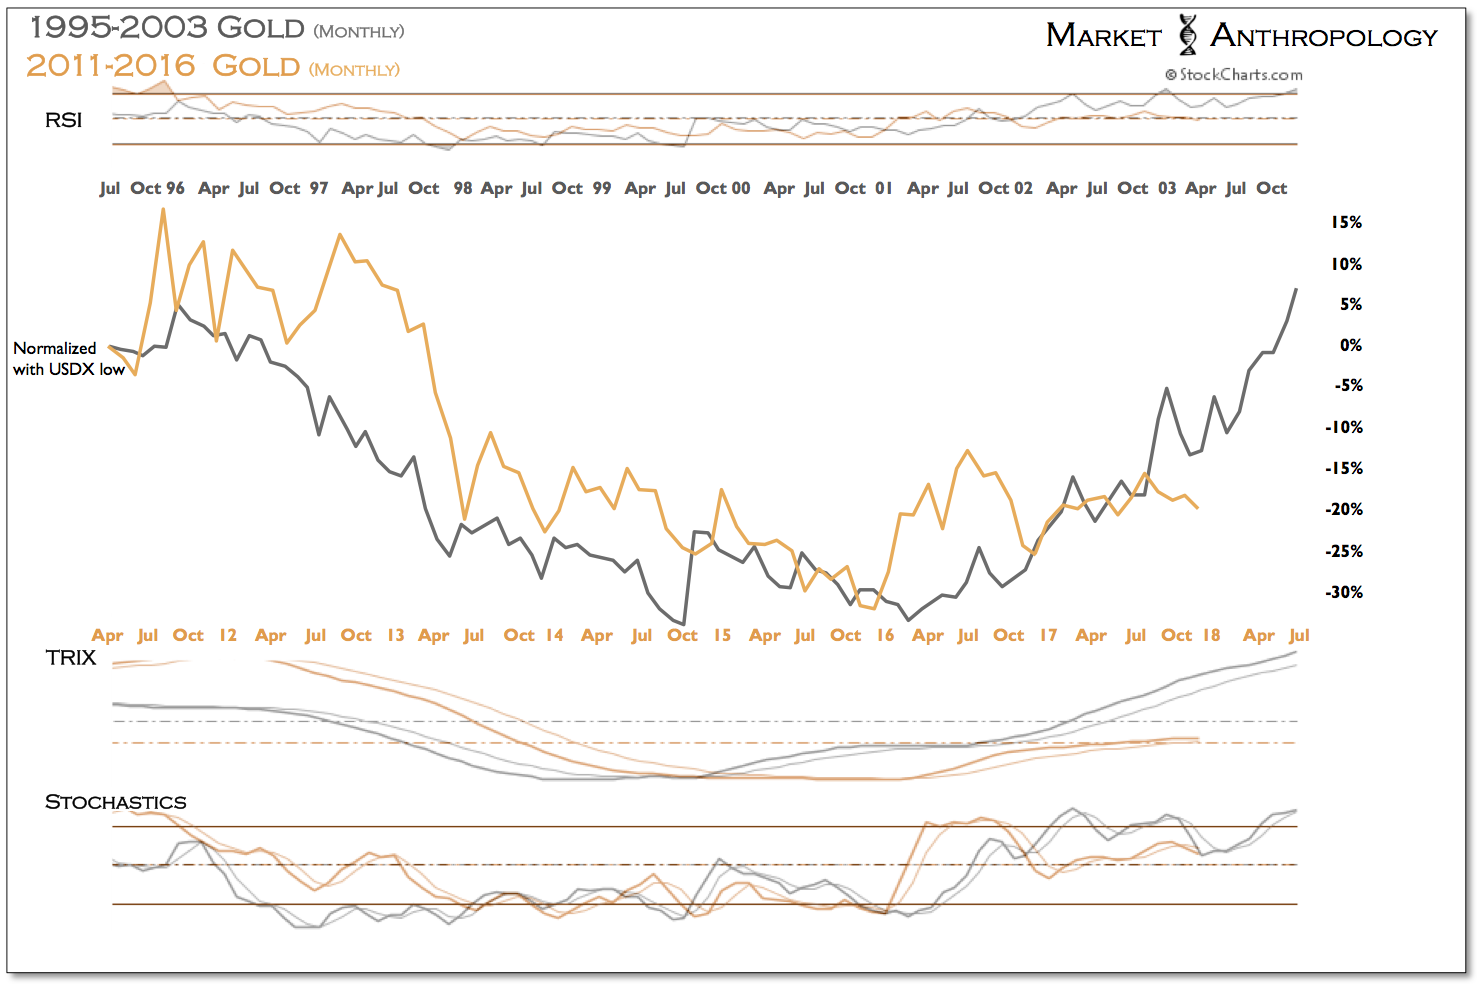
With November’s CPI report coinciding for release with the December Fed meeting announcement Wednesday afternoon, markets will be provided ample catalyst and reaction to trade between. Gold, which has remained mostly under pressure since its late summer high, has found major tradable lows shortly after the two previous December rate hikes in 2015 and 2016. It traded out of a bear market cycle low in December 2015 – directly after the Fed’s initial rate hike off ZIRP; and successfully defended that low the following December as the Fed hiked once more. Should the CPI report come in hotter than expected, look for gold to test underlying trend line support ~ 1215, before reversing course into the end of the year.

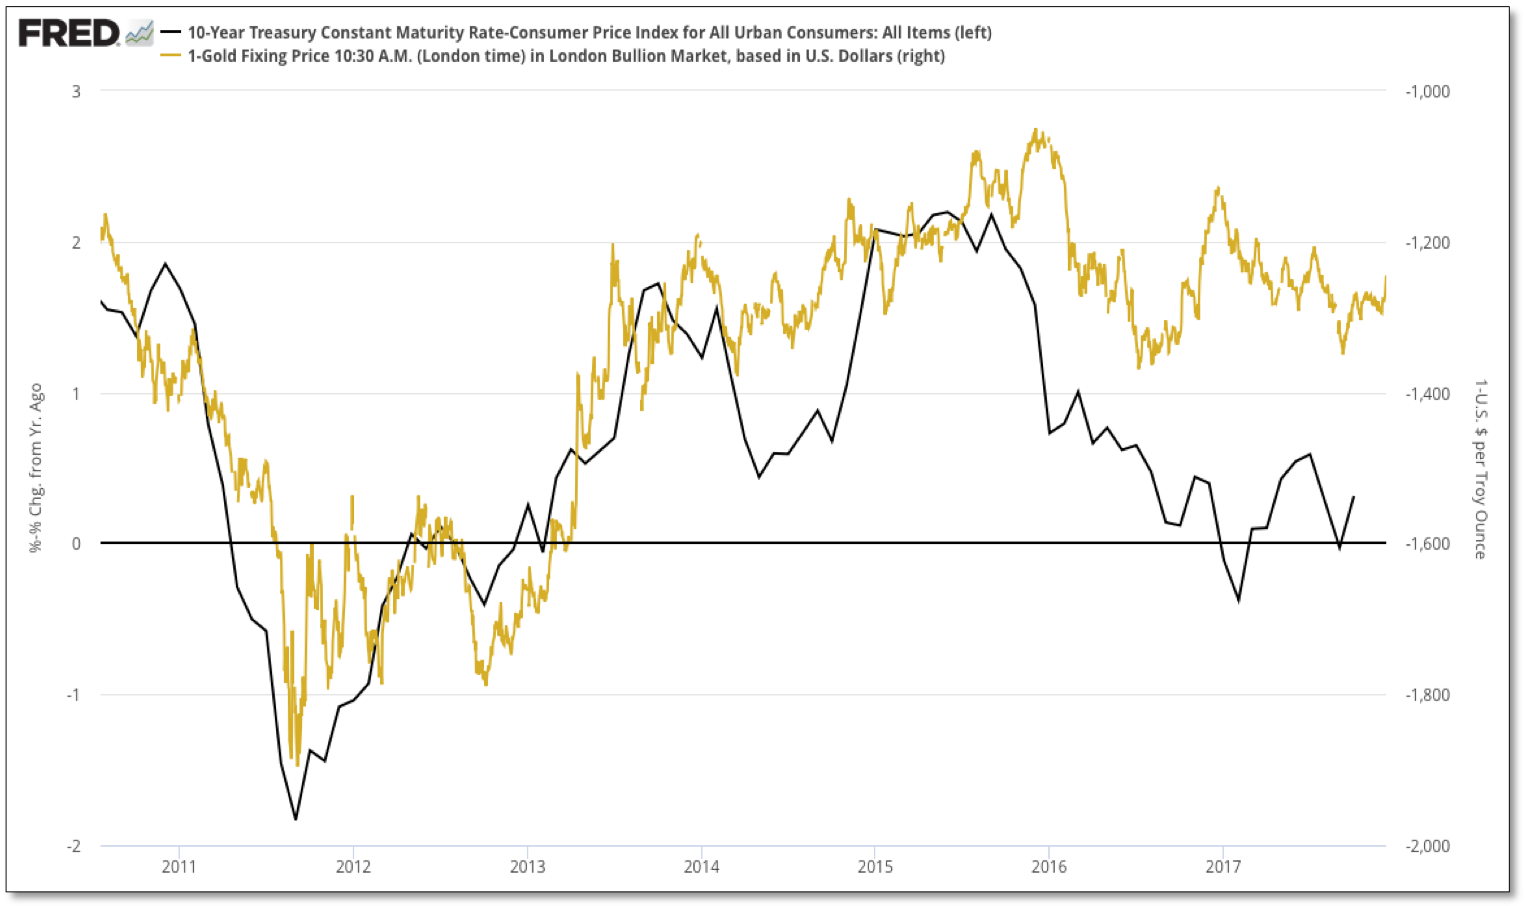
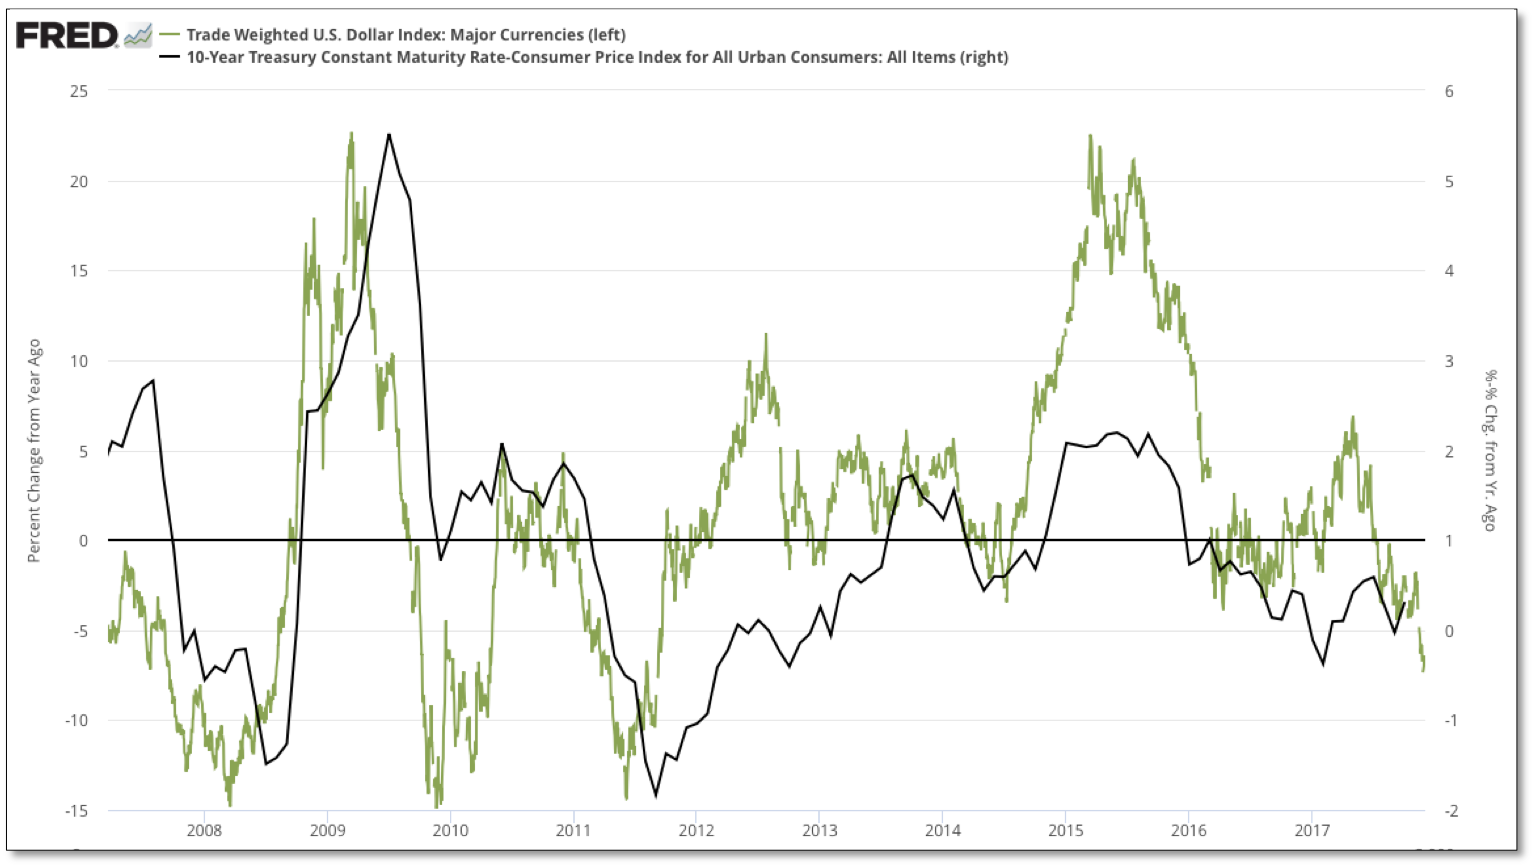
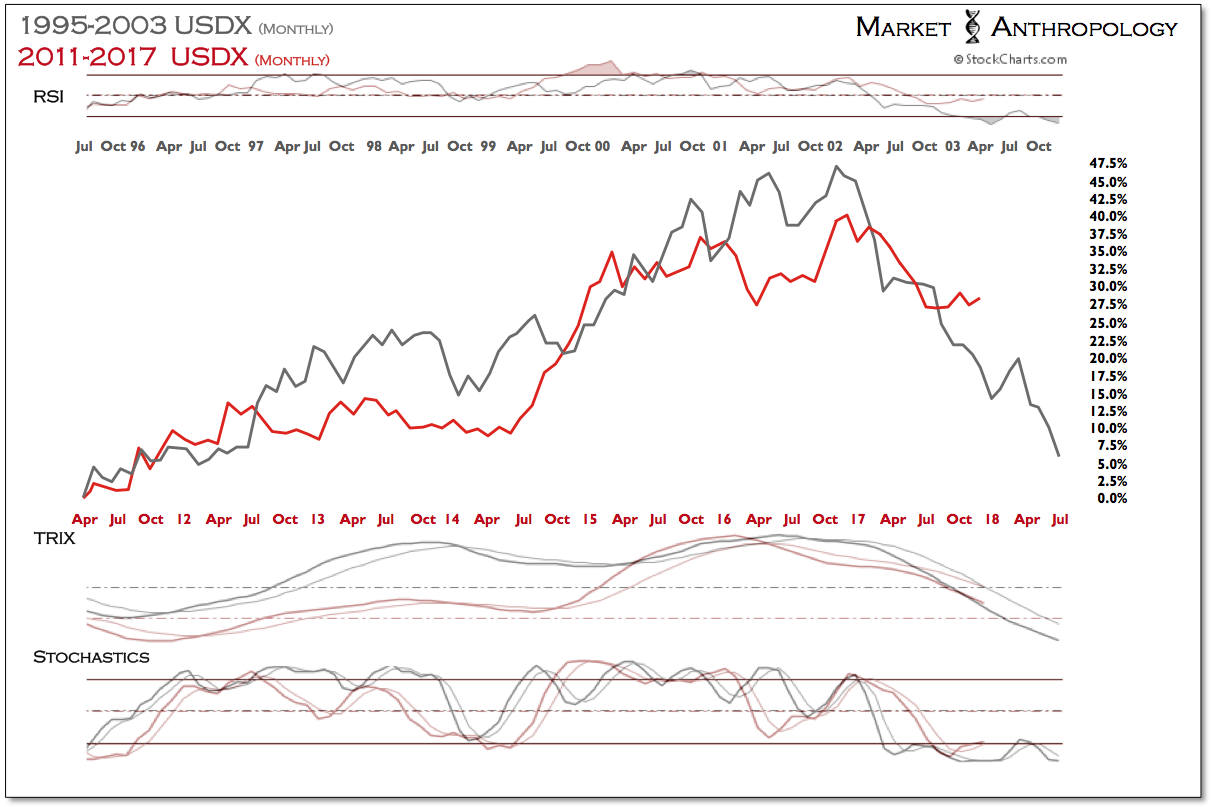
Generally speaking, gold has continued to trade higher – even as the Fed has raised rates four times over the past two years, predominantly because real yields have continued to fall as the dollar’s cyclical bull market turns down. In this regard, the dollar’s year-over-year performance trend has continued to decline this month, which would indicate that real yields should follow suit, largely supporting the cyclical uptrend in gold that began two years ago.
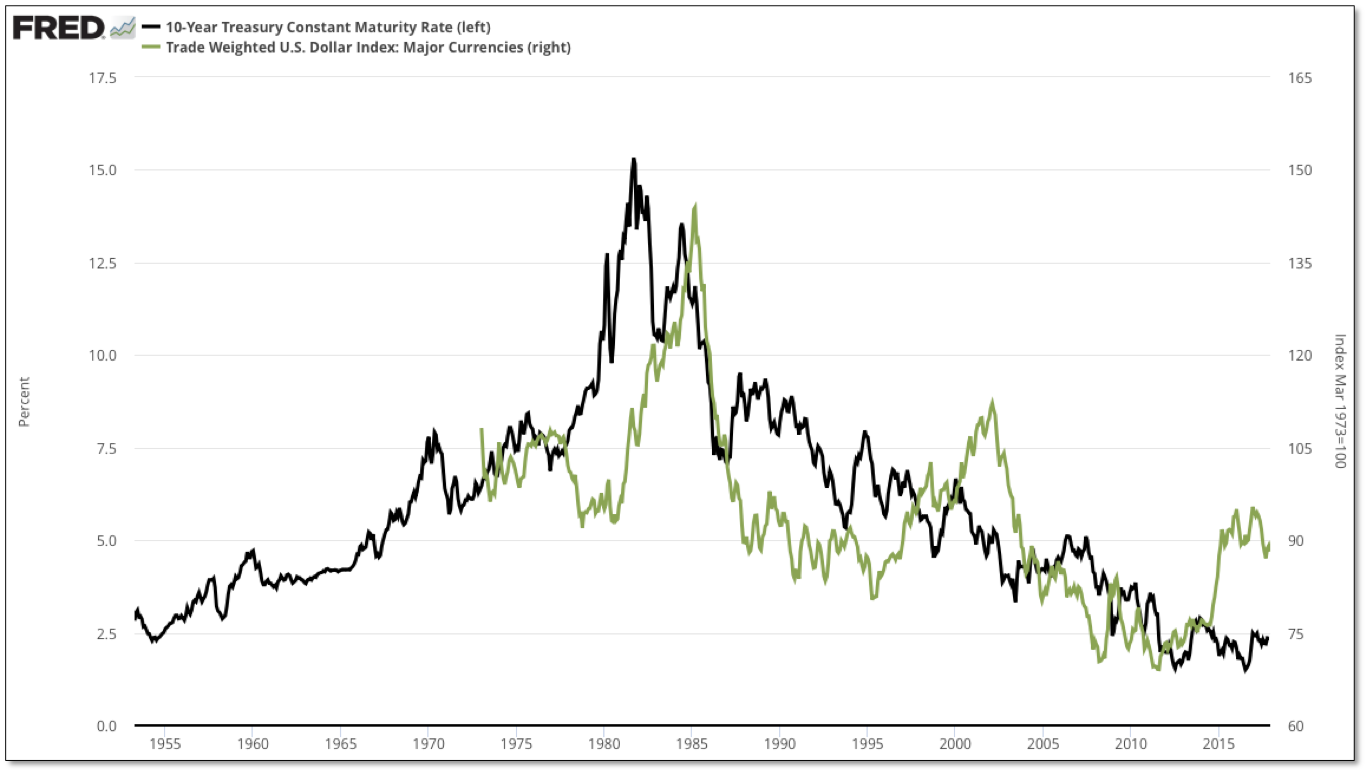
Overall, we continue to watch the slow battleship turn in the US dollar, with the fundamental belief that similar to the trend in long-term yields, the dollar will also work its way back down to the trough of its long-term range, coinciding with another cyclical move higher for gold and commodities in general.